F.FIT

F.FIT
F.FIT is a web application that helps you manage your money easily. It is a tool that helps you create and manage your monthly budgets without any hassle. It just requires your gross monthly income and then it automatically makes breaks up that amount as per a given ratio.
The Problem
IT’S HARD TO KEEP TRACK OF EXPENSES, INVESTMENTS
Solution Proposal
ONE TOOL TO CONTROL IT ALL!
- MANAGE YOUR MONTHLY BUDGETS
- SAVE MONEY DIRECTLY
- INVEST MONEY IN FROM VARIOUS AVAILABLE OPTIONS
- CREATE YOUR EMERGENCY FUND
- TRACK VARIOUS EXCHANGES AND MARKETS
- GET THE LATEST FINANCE RELATED NEWS
- GET FINANCIAL HELP
FRONTEND:
REACT JS
CSS
BOOTSTRAP
BACKEND:
JAVASCRIPT
DATABASE:
FIREBASE(CLOUD)
GROSS INCOME/BALANCE:
Budgeting is a great way of managing your money efficiently, to manage the financial stress one should know where their money is actually going hence your monthly gross income should be divided into a predefined ratio that you can choose, for example, 50: 30: 20. Where 50 % of your income would be your monthly expenses, 30 % would be your savings for something that you desire to purchase and 20% of the money would go into some kind of investment for your future.
Being able to direct money towards savings and paying off all your debts is the way to lead a healthier financial life.
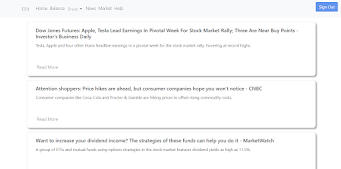
FINANCIAL NEWS:
News becomes important when it comes to investing, making strategic investments can result in huge profits, and also it can help you keep updated about what is happening in the world of finance. Hence there is a news section in F.Fit so that you can get the latest news and help you to plan your investments.
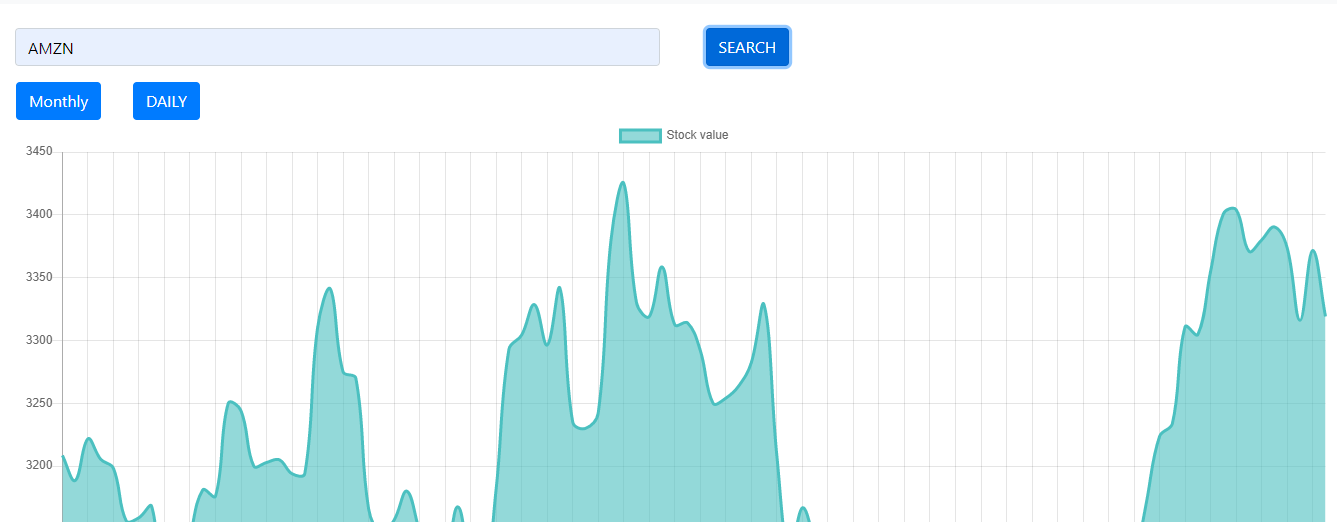
STOCK MARKET:
Investing in equities helps one to get returns that traditional investing methods cannot give and for that, it is crucial to track markets, F.Fit has a STOCK MARKET Section where a user can search for any stock and can see all the necessary information for that stock as well as there is a graph for the stock that can help a user see the highs and the lows of that particular stock where the user has an option to watch the graph of the stock since its inception or the graph for the past 6 months.

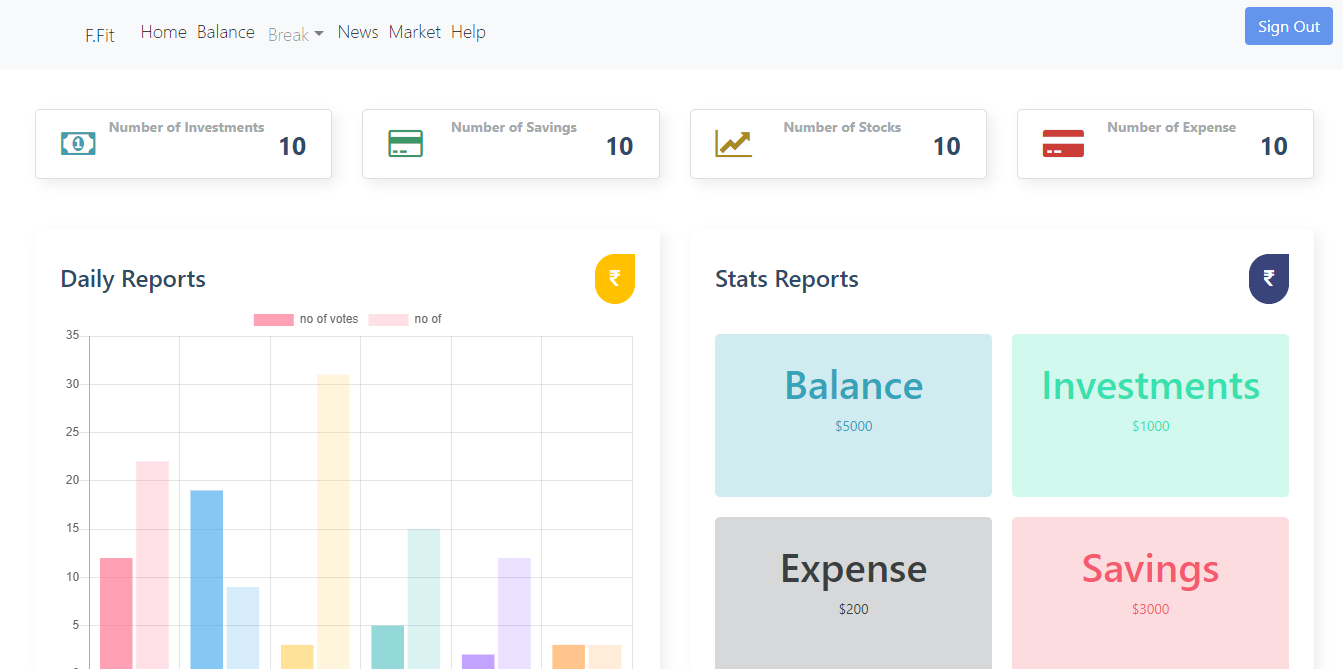
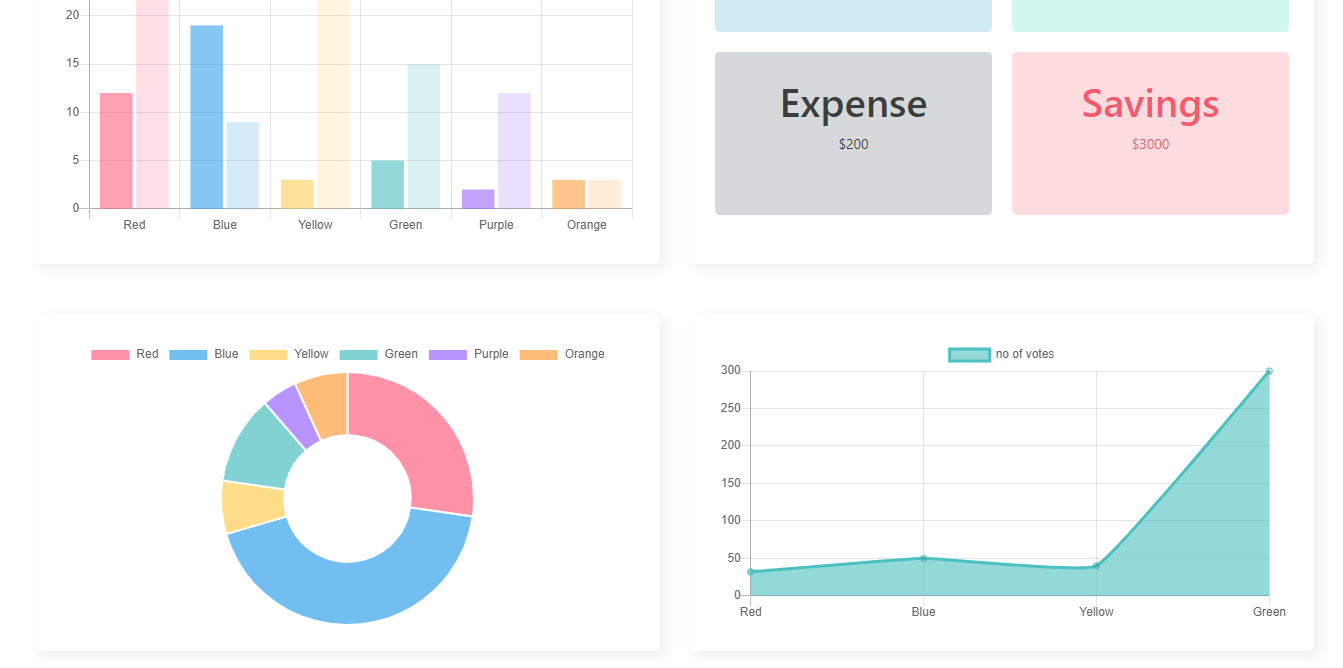
DASHBOARD:
The dashboard is where F.Fit brings it all together where a user can see all the expenses, savings and visualize their portfolio so they can have a look at it all at once.
WORK DISTRIBUTION

CLICK ON THE LINK BELOW TO HAVE A PEEK INTO OUR WEB APP WIREFRAME
CLICK HERE
MAKING STOCK SEARCH SUGGESTION AND MAKING IT MORE ROBUST
AUTOMATING SAVINGS
LINKING BANK ACCOUNT TO USER ACCOUNTS
USING AI TO SUGGEST
ENCRYPTION
Comments
Post a Comment